

This pathway complements NNLM’s resources on K-12 health by exploring evaluation considerations for programs that seek to improve health outcomes for students.
Whether you work in a K-12 school, community, or faith-based organization providing after-school programming, NNLM provides resources to help enrich your curriculum or program. Use this pathway to develop an evaluation tailored to this target population.
Working on a project with a small award (less than $10,000)? Use the Small Awards Evaluation Toolkit and Evaluation Worksheets to assist you in determining key components for your evaluation!
When developing an evaluation, consider the context of your program. The context can change how your evaluation is designed and implemented since different settings and populations have different needs and abilities to participate in evaluations.
Working with children
When evaluating programs for children, it is important to consider how engaging them in the process of gathering data is different from data collection with adults.
- Seek consent from parents and children participating in the study.
 Build rapport. Children may feel intimidated. Before administering a survey, review what types of questions will be asked, that there is no penalty for not answering, that they can ask questions at any time, and that they are free to end the survey at any time.
- Hire data collectors who have previous experience working with children. Hire individuals who know how to make children feel comfortable around adults they do not know and how to engage children without introducing bias in the survey.
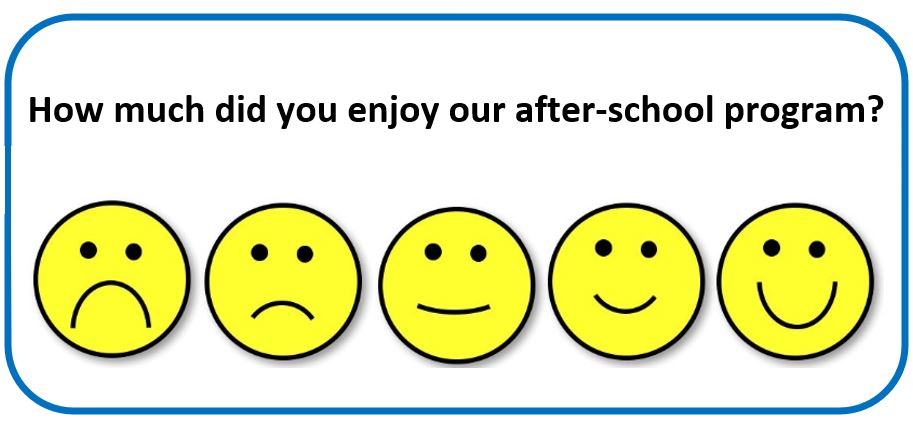
- Use visual stimuli. Especially with young children, it is helpful to use scales with images - like a smiley face chart - to assist them in expressing their opinions.
Program settings
- Collect data from the program setting site. For example, if the program is run in a school, data should only be collected from child participants in that school.
- Consider a clustered sample by school or classroom that takes into account differences that might exist in the implementation of the program. More information on sampling
- Consider the school calendar when collecting data. Do not schedule student surveys during major exams or holiday breaks. Work with classroom teachers to ensure students have enough time and a quiet location available to them to complete the survey.
Disparities in programming areas
- The sample population should reflect the real population of the program. For example, the distribution of race/ethnicity, gender, etc. in the sample of survey respondents should be similar to the distribution of these characteristics in the full population of program participants.
- Consider barriers to participation. Where there are barriers to participation for certain groups, consider how these groups' needs can be met to ensure equitable participation in the evaluation.
Step 1: Do a Community Assessment
The first step in designing your evaluation is a community assessment. The community assessment phase is completed in three segments:
- Get organized
- Gather information
- Assemble, interpret, and act on your findings
This phase includes outreach, background research, networking, reflecting on the evaluation and program goals, and formulating evaluation questions.
Conduct a stakeholder analysis to identify individuals or groups who are particularly proactive or involved in the community. Find out why they are involved, what is going well in their community, and what they would like to see improved.
Overlapping Spheres of Influence
For K-12 programs, consider a child's 'overlapping spheres of influence' when identifying stakeholders. These spheres, when working together to guide and support student learning, improve outcomes for students. Stakeholders within each of these spheres should be considered when developing your community assessment.
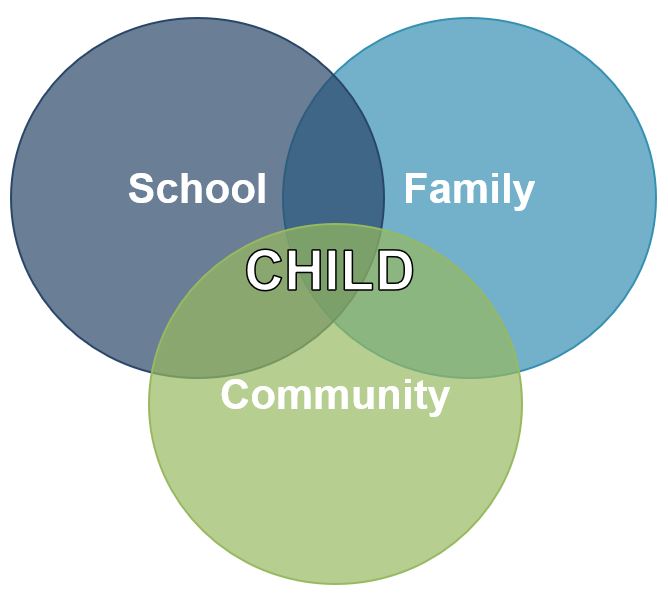
- School - Teachers, Support staff, Administration
- Family - Immediate (parents/caregivers, siblings) and Extended (grandparents, aunts/uncles, cousins, etc.), where those extended family members play an active role in the child's life. Extended family may be especially important in contexts where children live in multi-generational households.
- Community - Organizations providing enrichment activities, workplaces for youth, places of worship, libraries, etc.
Positive Deviance
- Consider identifying early adopters in each of the Overlapping Spheres of Influence. When creating a community assessment, consider the questions that could be asked of school, family, and community stakeholders to help identify these individuals and their role in the community.
- Use the Positive Deviance (PD) approach to identify these early adopters.
- Please note this process is time and labor intensive and requires a skilled facilitator comfortable with ambiguity and uncertainty. This process may not be feasible within the time constraints of the typical NNLM-funded project.
SWOT Analysis
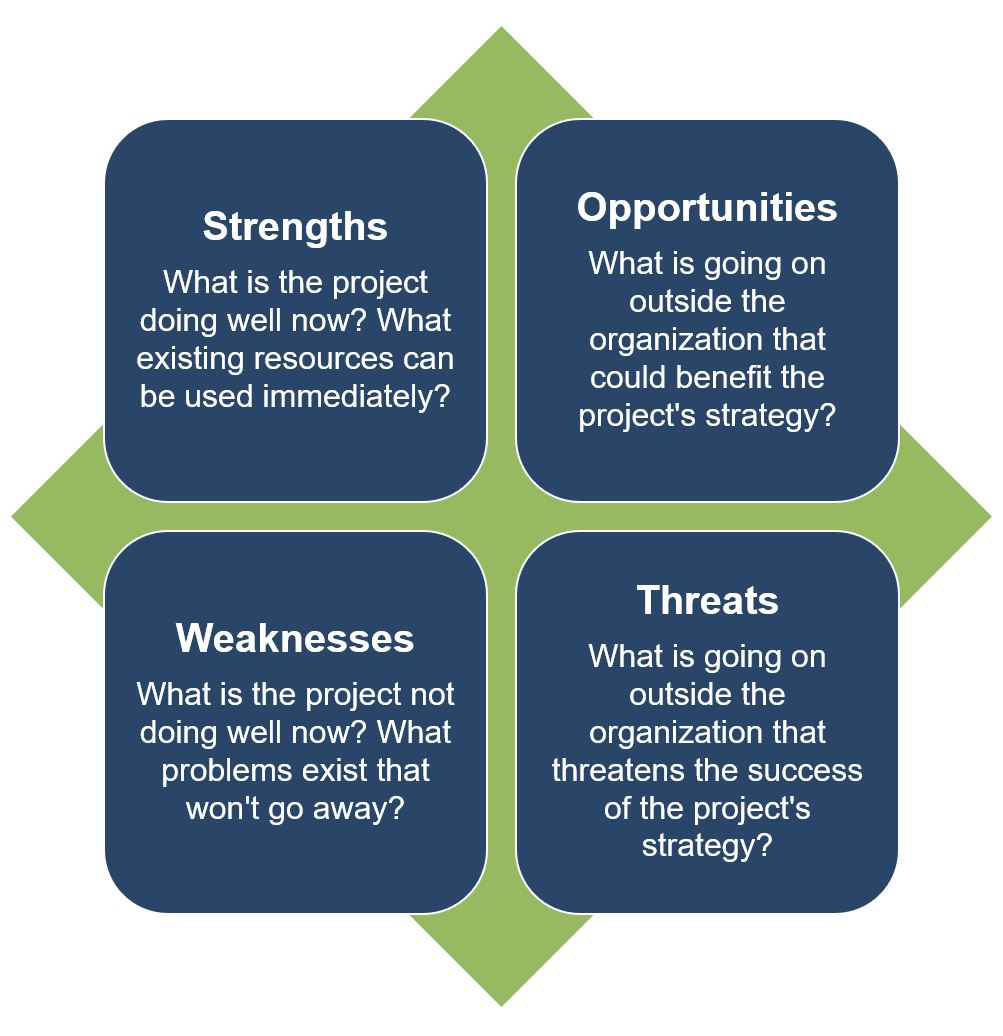
- As part of the K-12 stakeholder analysis, conduct a SWOT Analysis for the program to identify what you and your team already know.
- A SWOT analysis is typically used to assess an organization or program's internal strengths and weaknesses and the opportunities and threats to the organization or program in the external target community.
- More information on SWOT Analysis
- Example K-12 SWOT Analysis
This phase includes gathering data from different external and internal sources to inform the development of your program and evaluation plan.
Consider how survey delivery may vary across the ‘Spheres of Influence.’ School stakeholders are likely to have the language skills and technology required to answer questions via an online survey (distributed via email or a shared link), while family or community members may require phone or in-person surveys conducted by the project team or a paper and pencil survey used during an in-person event.
Community Youth Mapping
- When working with youth, consider gathering information using a community youth mapping approach. This youth-led strategy engages youth in canvassing their communities to document resources, needs, and opportunities. Viewing the assets of a community through the perspective of those a K-12 program serves often provides a more comprehensive assessment of what resources are available in the community and how best the new program will build upon these assets.
- Example K-12 Community Youth Mapping Exercise
Existing Data Sources
- Existing data, where available, can be a helpful resource for developing your evaluation plan.
- The following data sources CANNOT be used to report against program outcomes, but they may be helpful during a needs assessment or program design phase in understanding the context in which the program will be placed:
- The Youth Risk Behavior Surveillance System (YRBSS) tracks health behaviors at the national, state, territorial, tribal, and local levels.
- Categories of health-related behaviors or classifications monitored include sexual behaviors and identity, alcohol and other drug use, unhealthy dietary behaviors, inadequate physical activity, and others.
- Programs planned to address student alcohol and drug use could use YRBSS data as the background for creating a needs assessment for the program or to highlight the need for their intervention as part of the program design.
- Outcomes related to a change in student attitudes at the end of the program would require a survey administered to the participants to measure that change.
- The Kids Count data center allows users to browse data related to children and families. The Foundation also produces an annual comprehensive report – the Kids Count Data Book – on child well-being in the United States.
- Data are tracked across geographical areas (national, state, territory, city) and by community and family demographics.
- Indicators included in the database are economic well-being, education, family and community, health, and safety and risky behaviors.
- Kids Count data could help to inform the program need in a certain context and by specific demographics.
- Outcomes related to the impact of a specific intervention on students would need to be measured directly using a tool tailored to the outcomes and evaluation question(s).
- The Youth Risk Behavior Surveillance System (YRBSS) tracks health behaviors at the national, state, territorial, tribal, and local levels.
This phase includes processing the information gathered into understandable takeaways that can be used for the program and the evaluation.
Whole School, Whole Community, Whole Child (WSCC) Model
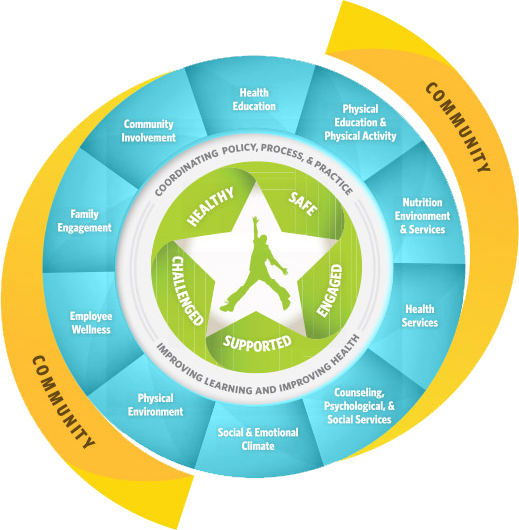
- Consider the Whole School, Whole Community, Whole Child (WSCC) model as a way of aligning your project within the larger system of K-12 health interventions. Aligning efforts with other community members and systems lessens the burden on a single program to meet all needs.
- The WSCC model is the CDC’s framework for addressing health in schools. The model is student-centered and emphasizes the role of the community in supporting programming.
- Strategies for using the WSCC framework are available through the CDC website and include recommendations for integrated school health services, integrated nutrition services, out-of-school time use, and physical education and physical activity.
Effective Health Education Curriculum
- Curricula chosen for K-12 health programming should be reviewed by program staff to ensure it meets the goals of the specific program.
The CDC has identified 14 characteristics of effective health education curriculum. These include:
Focus on clear health goals and related behavioral outcomes Research-based and theory-driven Addresses individual values, attitudes, and beliefs Addresses individual and group norms that support health-enhancing behaviors Focuses on reinforcing protective factors and increasing perceptions of personal risk and harmfulness of engaging in specific unhealthy practices and behaviors Addresses social pressures and influences Builds personal competence, social competence, and self-efficacy by addressing skills Provides functional health knowledge that is basic, accurate, and directly contributes to health-promoting decisions and behaviors Uses strategies designed to personalize information and engage students Provides age-appropriate and developmentally-appropriate information, learning strategies, teaching methods, and materials Incorporates learning strategies, teaching methods, and materials that are culturally inclusive Provides adequate time for instruction and learning Provides opportunities to reinforce skills and positive health behaviors Provides opportunities to make positive connections with influential others 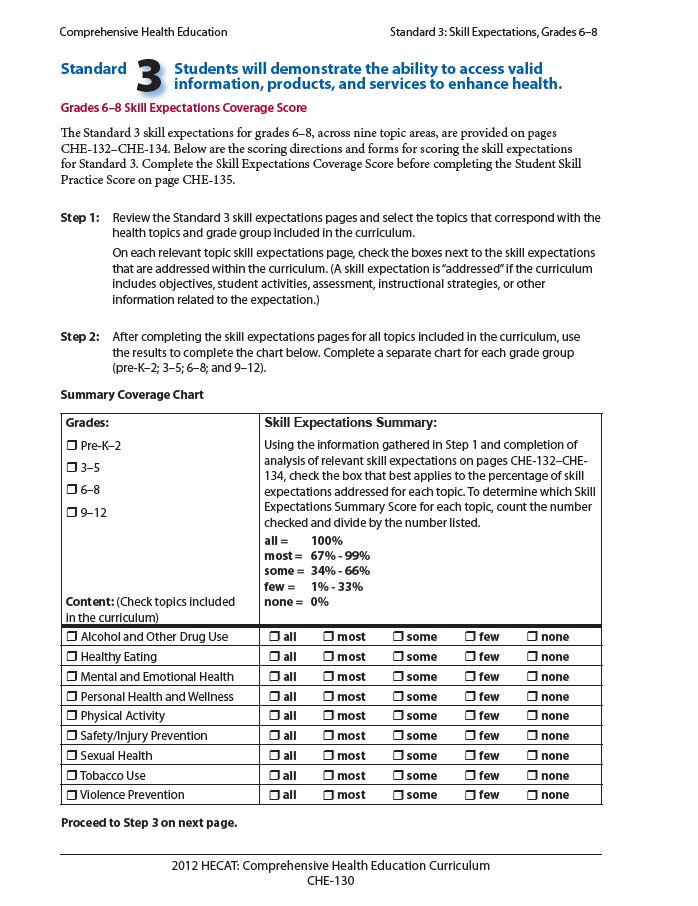
- Use one of the following tools to analyze the ability of the curricula to meet the needs of students and goals of the program design:
- The Health Education Curriculum Analysis Tool (HECAT) is an assessment tool developed to conduct an analysis of health education curricula based on the National Health Education Standards and CDC’s Characteristics of an Effective Health Education Curriculum. The HECAT can be customized to meet local community needs and conform to the curriculum requirements of the state or school district.
- Designed for schools, the Physical Education Curriculum Analysis Tool (PECAT) could be used to measure the quality of any curriculum developed for physical health K-12 programs. Similar to the HECAT, the PECAT is a self-assessment and planning guide developed to conduct an analysis of physical education curricula based upon national physical education standards.
Step 2: Make a Logic Model
The second step in designing your evaluation is to make a logic model. The logic model is a helpful tool for planning a program, implementing a program, monitoring the progress of a program, and evaluating the success of a program.
Consider how the program's logic model will assist in determining what is, or is not, working in the program's design to achieve the desired results. In K-12 health promotion programming, it is crucial to consider the quality of the curriculum, along with the level of engagement by students in engaging with the curriculum, to achieve the program’s outcomes. Be open to new and alternative patterns in your logic model. Have stakeholders and community members review your logic model, paying particular care to how change occurs across the logic model. Listen to voices who can say whether the strategies are beneficial, and whether strategies could be successful.
More information on Logic Models
Tearless Logic Model
- To facilitate the creation of the logic model, community-based organizations can consider using the Tearless Logic Model process.
- The Tearless Logic Model uses a series of questions to assist non-evaluators in completing the components of the logic model. Questions used in the Tearless Logic Model
Knowledge, Attitudes, & Behaviors
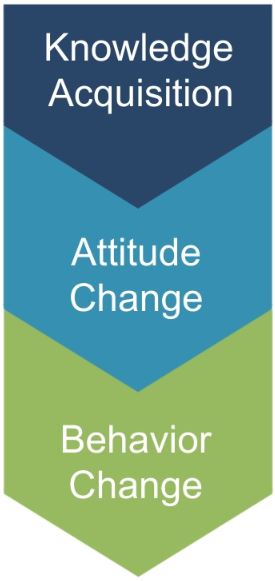
- Programming should consider improvement in the knowledge-attitude-behavior continuum among program participants as a measure of success. The process of influencing health behavior through information, followed by attitude changes and subsequent behavior change, should be documented in the logic model.
- Focusing on behavior change is more likely to require Institutional Review Board (IRB) approval.
- Knowledge Acquisition:
- What is the program trying to teach or show program participants?
- What understanding would a program participant gain over the course of the program? Often knowledge acquisition occurs as a short-term outcome of the program.
- Be sure to examine not only what is learned, but where, when, and how program participants will learn it.
- Attitude Change:
- What mindsets or beliefs is the program seeking to build or change? Be sure to consider cultural differences in attitudes in the community you are working with.
- Are there misconceptions about the topic, and does that belief change after the curriculum has been implemented?
- To what extent do participants agree with statements related to the new material presented?
- Behavior Change:
- After some time has passed from implementation of the curriculum, are the actions of program participants different than what they presented before the program began?
- Are the new behaviors in alignment with the expectations of the program's curriculum?
- Note that most NNLM projects focus on the dissemination of health information/health education and often do not take place over a long enough period of time to observe behavior change.
- As such, examining/measuring behavior change may be out of the scope of the NNLM-funded project unless the projects runs for multiple cycles over an extended period of time.
Step 3: Develop Indicators for Your Logic Model
The third step in designing your evaluation is to select measurable indicators for outcomes in your logic model.
Measurable Indicators
- Consider whether your outcomes are short-term, intermediate, or long-term
- Most NNLM projects are of short duration and should focus only on short-term or intermediate outcomes.
- It may be necessary to use more than one indicator to cover all elements of a single outcome.
- How to develop measurable indicators
- Example K-12 Measurable Indicators
National Health Education Standards (NHES)
- The NHES include indicators for measuring K-12 health program objectives.
- Each Standard includes expectations for what students should know and be able to do by grades 2, 5, 8, and 12 to promote personal, family, and community health.
Indicators for each Standard, by grade level, are shared through the links below:
Standard 1: Students will comprehend concepts related to health promotion and disease prevention to enhance health Standard 2: Students will analyze the influence of family, peers, culture, media, technology, and other factors on health behaviors Standard 3: Students will demonstrate the ability to access valid information, products, and services to enhance health Standard 4: Students will demonstrate the ability to use interpersonal communication skills to enhance health and avoid or reduce health risks Standard 5: Students will demonstrate the ability to used decision-making skills to enhance health Standard 6: Students will demonstrate the ability to use goal-setting skills to enhance health Standard 7: Students will demonstrate the ability to practice health-enhancing behaviors and avoid or reduce health risks Standard 8: Students will demonstrate the ability to advocate for personal, family, and community health
Demographic Data
- Collect data on demographics as part of your survey process. It is important to understand your participants' backgrounds and how that may affect their engagement with your program.
- During analysis, compare differences in backgrounds against outcome results. If there are gaps identified in reaching certain populations, consider adjustments to program implementation to serve all participants equitably.
- More information on collecting demographic data
Step 4: Create an Evaluation Plan
The fourth step in designing your evaluation is to create the evaluation plan. This includes:
- Defining evaluation questions
- Developing the evaluation design
- Conducting an ethical review
- Evaluation questions help define what to measure and provide clarity and direction to the project.
- Process questions relate to the implementation of the program and ask questions about the input, activities, and outputs columns of the logic model.
- Outcome questions relate to the effects of the program and relate to the short, intermediate, and long-term columns of the logic model.
- Evaluation design influences the validity of the results.
- Most NNLM grant projects will use a non-experimental or quasi-experimental design.
- Quasi-experimental evaluations include surveys of a comparison group - individuals not participating in the program but with similar characteristics to the participants - to isolate the impact of the program from other external factors that may change attitudes or behaviors.
- Non-experimental evaluations only survey program participants.
- If comparison groups are part of your quasi-experimental design, use a 'do no harm' approach that makes the program available to those in the comparison group after the evaluation period has ended.
- More information on Evaluation Design
Ethical Considerations
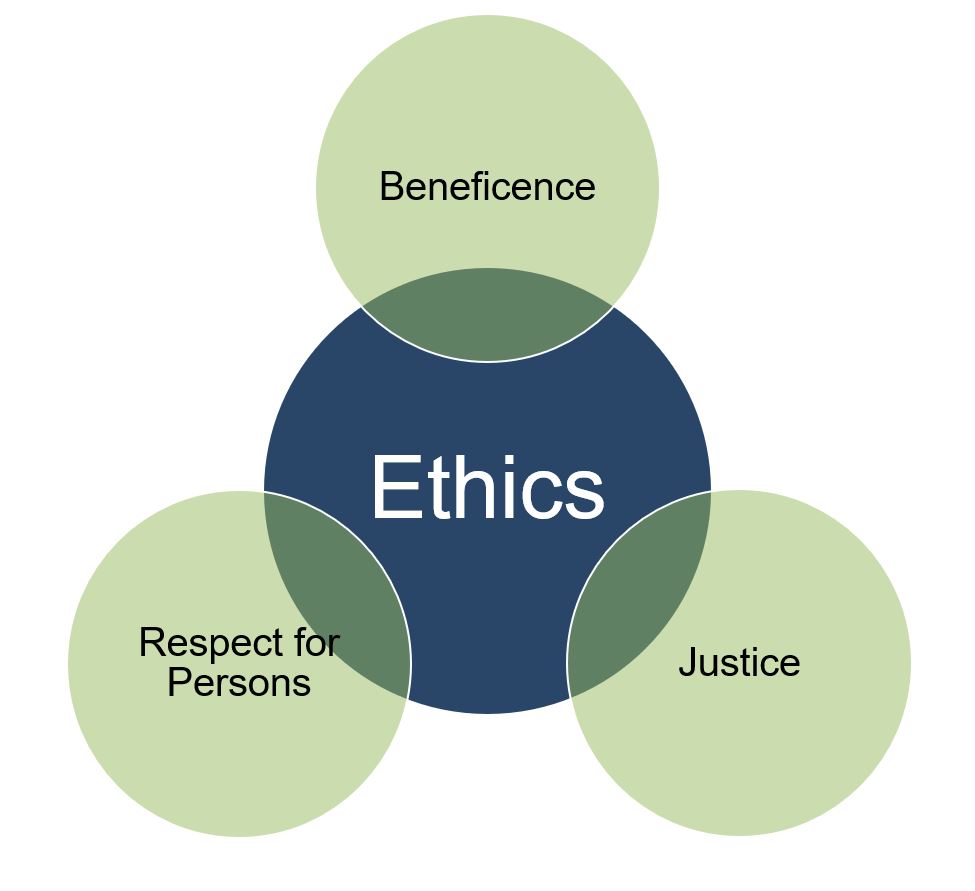
Consider the Belmont Report principles to examine K-12 population ethical considerations:
- Respect for Persons:
- Engage parents/guardians in the evaluation process as minors may not be able to appropriately self-determine their involvement.
- Evaluations should use and understand age-appropriate methods of communication and understanding.
- If utilizing educators and/or school staff in your evaluation plan, consider work loads and how to compensate staff appropriately for additional work required to complete the evaluation.
- Beneficence
- Removing school aged children from classes, or shortening classes, to complete evaluation activities may reduce the benefits they receive from the class. Schedule evaluation activities at a time that will cause the least disruption.
- Consider the indirect benefits that future classes of school-aged children will receive from the evaluation, not just the subjects of the current evaluation.
- Justice
- When considering K-12 evaluation plans, look at the distribution of burdens across the children in your evaluation:
- Are all children sharing the same burdens and benefits, or are there certain factors, such as income or learning level, that require some students receive more or less support?
- Other factors to consider include parental or guardian support of children, English as a second language (ESL) students, student disability, mental health conditions, transportation availability, the stability and safety of student living situations.
- When considering K-12 evaluation plans, look at the distribution of burdens across the children in your evaluation:
Trauma-Informed Evaluation
- Asking someone about trauma is asking that person to recall potentially difficult events from their past.
- If absolutely necessary for the evaluation to ask questions about potentially traumatic events, incorporate a trauma-informed approach to collect data in a sensitive way.
- Amherst H. Wilder Foundation Fact Sheet on Trauma-Informed Evaluation
- More information on Trauma-Informed Evaluation
- If collecting data in schools, please consult with your school and school district to determine if an external review of your evaluation plan or data collection practices are required.
- The Institutional Review Board (IRB) is an administrative body established to protect the rights and welfare of human research subjects recruited to participate in research activities.
- The IRB is charged with the responsibility of reviewing all research, prior to its initiation (whether funded or not), involving human participants.
- The IRB is concerned with protecting the welfare, rights, and privacy of human subjects.
- The IRB has authority to approve, disapprove, monitor, and require modifications in all research activities that fall within its jurisdiction as specified by both the federal regulations and institutional policy.
- Click here for more information on the IRB, including contact information for your local IRB
- Depending on the nature of the evaluation, the IRB may exempt a program from approval, but an initial review by the Board is recommended for all programs working with minors.
Step 5: Collect Data, Analyze, and Act
The fifth step in designing your evaluation is to implement the evaluation - Collect Data, Analyze, and Act! As part of an evaluation, you should:
- Collect data before, during, and after your program has completed
- Complete analysis after the completion of data collection
- Act upon your analysis by sharing evaluation results with stakeholders, and if needed, adapt future iterations of your program to address gaps identified through the evaluation
- Ensure the privacy and confidentiality of all participants. For K-12 programming, this includes obtaining consent from parents/guardians and assent from minor participants.
- Select a sampling strategy that will allow for reporting on program outcomes.
- Consider whether quantitative and/or qualitative data collection methods are appropriate for reporting on program outcomes.
Privacy/Confidentiality
- Privacy and confidentiality of collected data should be ensured.
- Seek consent from parents and children participating in the study.
- Consider how you will secure data collected to protect sensitive information.
- Data stored electronically should, at minimum, be password-protected.
- If collecting data in a school, ensure you are meeting the data security protocols set by the school district or school administration.
Sampling Strategies
- Sampling is the way that individuals are selected from a larger group to complete data collection activities.
- Generally, sampling strategies can be divided into non-probability sampling and probability (random) sampling.
- Sample size calculators are useful for determining the number of data points that are needed to detect a statistically significant difference.
- More information on sampling strategies
Choosing a Sampling Strategy
- Is a sample needed or is your program population small enough that it is feasible to survey everyone?
- For an after-school program with 20 participants, for example, the total number of participants is small enough that it is likely more work to create a truly representative sample.
- However, if a program is operating in all 8th grade classrooms in the region, collecting data from a sample of students will likely save time and money and produce similar results as surveying all students.
- If a sample will be selected, will it be necessary to conduct probability (statistical) sampling?
- If it is not feasible to compile a list of sampling units, random selection (required for statistical samples) will not be possible.
- In K-12 programming in a school, for example, you would need a full roster of student participants to create a truly random sample. If school confidentiality rules prevent this, a random selection of students would not be possible.
- In addition, if you do not intend to generalize to the full participant population (i.e. you won't make conclusions about all participants based on data from a sample of participants), probability sampling is not necessary. Non-probability samples may provide enough information and are less cumbersome to select.
- If it is not feasible to compile a list of sampling units, random selection (required for statistical samples) will not be possible.
Non-probability Sampling
| Sampling strategy | Example use in K-12 programming |
|---|---|
| Convenience sample | Select individuals visiting the library to access a specific education course. |
| Quota sample | If you want to survey users of a specific education course and the local school has shared that 20% of the students come from low-income families, you would ensure 20% of your survey respondents were students from low-income families. |
| Volunteer or self-selected sample | Students who are willing to visit the library to access the specific education course are the survey participants. |
Probability Sampling
- In K-12 settings, particularly for programs in schools, it may be difficult to draw a truly random sample of students from the same school based on use of the curriculum.
- Though each student may not directly interact with the curricula, social engagement with others in the school means knowledge gained from the curricula could still permeate throughout the school.
| Sampling strategy | Example use in K-12 programming |
|---|---|
| Simple random sample | At the library providing a specific education course, library staff can use a random numbers table to determine which of the pre- and post- knowledge tests will be used as part of the evaluation once survey results have been collected from all participants. |
| Systematic random sample | At the library providing a specific education course, library staff may choose to interview every third person who uses the materials. In a school setting where curricula is used in all classrooms, teachers could alphabetize their attendance roster and the evaluator would choose every other student. |
| Stratified sample | Begin by assigning students to groups according to a common trait – sex, socioeconomic status, etc. From there, a random group of students from each strata (group) would be selected to participate in the study. |
| Cluster sample | This method can be especially beneficial in a school where the course is administered through individual classrooms. The survey will need to take into consideration the possibility of knowledge sharing happening beyond the classroom walls, but it is still a beneficial method for evaluating how the use of the course may vary by instructor. |
Data Collection Methods
| Data collection method | Example use in K-12 programming |
|---|---|
| Questionnaire/ Survey | Questionnaires or surveys are a good solution for collecting data from a large group of participants, say school-wide, or from many different stakeholders, like students, parents, and teachers. |
| Knowledge assessment | Knowledge assessments are strongly recommended for any program that is centered on specific curriculum for achieving program goals. |
| Focus Group | Focus groups are a good way of collecting data from any stakeholder group (students, parents, community members, etc.) that have shared a common role within the program. While knowledge assessments are critical for understanding if the program content has been understood, focus groups can be beneficial in helping program staff understand if the way in which the program has been implemented was effective, efficient, and ultimately sustainable. |
| Observation | Observations can assist evaluators in understanding how effective their program is working over time. Facilitating the curriculum over many sessions will show if and how it is being taught with fidelity, while the attitude and behavior changes of students over time likely reflect the level of quality of the curriculum and its use through the program. |
| Interview | Interviews can serve to solicit specific information from individual stakeholders. |
Quantitative Analysis
- Quantitative data are information gathered in numeric form.
- Analysis of quantitative data requires statistical methods.
- Results are typically summarized in graphs, tables, or charts.
- More information on quantitative analysis.
Qualitative Analysis
- Qualitative data are information gathered in non-numeric form, usually in text or narrative form.
- Analysis of qualitative data relies heavily on interpretation.
- Qualitative data analysis can often answer the 'why' or 'how' of evaluation questions.
- More information on qualitative analysis.
- Share information gathered in your evaluation with stakeholders to ensure they understand your program successes and challenges.
- Align stakeholders around the program and allow for planning for future iterations or versions of the program.
- Evaluations can be summarized as evaluation reports, Power Point Presentations, dashboards, static infographics, and/or 2-page briefs depending on the needs of stakeholders.
Meeting K-12 Stakeholder Needs
- Consider again the 'Overlapping Spheres of Influence' when reporting program results:
- Who are the stakeholders at the school, family, and community level?
- What do your stakeholders need to know?
- What do you hope to gain by sharing results? How can you communicate these findings to specific stakeholders in a way that brings understanding and encourages use of the results?
- Where confidentiality has been ensured, results should not be presented at an individual level, even to the parents/guardians
Example Evaluation Plan
Healthy Bodies = Healthy Minds is a summer program targeting youth from food-insecure households. A partnership between the city’s high schools, library, and food bank ensures students not only receive nutritious food throughout the summer but also recipes for healthy nutrition, preparation and storage tips for food, and information on accessing other local nutrition resources. The local library hosts the learning sessions, using the EatFresh.org Mini Course. Each self-paced topic takes 5-10 minutes to complete and boosts the individuals’ nutrition, cooking, and healthy living knowledge.
In addition to serving the local community to meet immediate health needs, Healthy Bodies = Healthy Minds will also boost library staff’s confidence in meeting community members’ needs in accessing health information. Staff will complete the NNLM course, “Stand Up for Health: Health and Wellness Services for Your Community for Public Libraries,” as part of their training to implement the Healthy Bodies = Healthy Minds program.
One goal of Healthy Bodies = Healthy Minds is to address the needs of those students who are low-income. One targeted program approach is providing bus passes to those students who otherwise would not be able to visit the library. In the evaluation plan, the program staff have agreed to ask these students additional questions about their use of the bus pass – how it is meeting the need of accessing the library, as well as any unintended benefits, like increased access to the food bank or place of employment, or unintended consequences.
SWOT Analysis
Prior to rolling out the program, Healthy Bodies = Health Minds library staff met to discuss the team's internal strengths and weaknesses, as well as the strengths and barriers in the community to providing a quality program. In addition, they consulted with staff from the local school and food bank to ensure multiple stakeholders' views were included. The results of that SWOT Analysis are in the diagram below.
Strengths
- Partnerships between school, food bank, and library already established
- Tested curriculum ready for use
- Examples of effective programs in other cities
- Effective community-level programs and initiatives (e.g. food bank-school linkage)
- Society expresses support for students and their health
- Increased use of technology in community and schools
- Financial resources available to support program, including covering transportation costs for students
Opportunities
- Educate using technology
- Build relationships between library staff and students
- Library seen as hub for health-related information
- Educate public and parents through connections with students
- Develop coalitions to coordinate services year-round
- Educate library staff on technology and assisting public in accessing health information
Weaknesses
- All students in community not reached through current program
- Students may not seek access to the program
- Language barriers, lack of interpreters or translated electronic material
- Public’s limited access to technology outside of the library setting
- Lack of adequate financial resources to expand the program beyond the pilot phase
- Mass/social media sends contradictory messages
- Limited library hours for access to health information
- Public understanding of healthy eating habits limited in some contexts
Threats
- Budget cuts, lack of financial resources
- Lack of personnel
- Time constraints for teaching students
- Students can be overwhelmed with information
- Families not willing to act upon lessons learned by students
- Personal bias, attitudes
- Resistance to change personal behavior
Community Youth Mapping
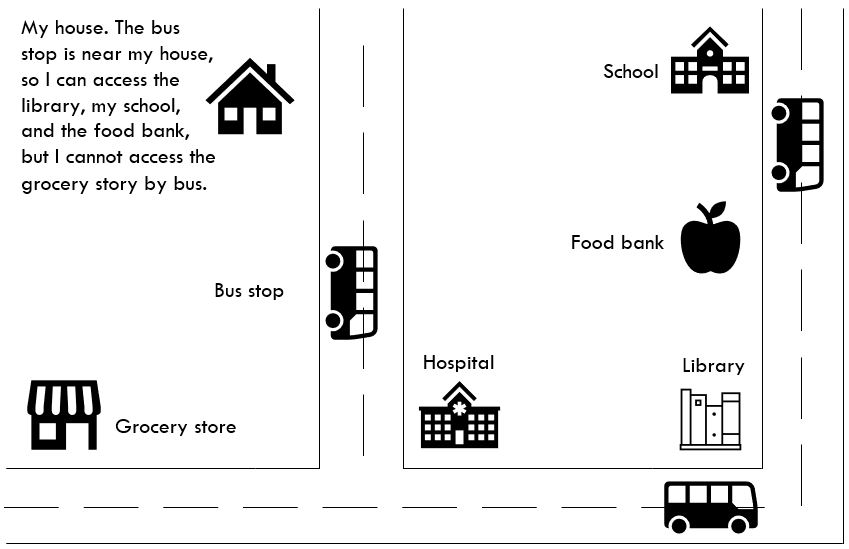
As part of the Gathering Information stage of Step 1, Healthy Bodies = Healthy Minds staff met with potential student participants to map resources in their communities. Through this process, staff discovered some students might have difficulty accessing the grocery store due to lack of public transportation. Through their partnership with the local school and food bank, they can use this information to ensure all students are able to access the resources they need to thrive.
Logic Model
Developing a program logic model assists program staff and other stakeholders in defining the goals of a project and develops a road map for getting to the goals. The logic model is also used during the evaluation process to measure progress toward the program goals.
The Healthy Bodies = Healthy Minds logic model is below.
Goal: Improve understanding of nutrition best practices and use this to change habits and household norms
Inputs
What we invest
- Library staff member time for training on new material & liaising with community partners
- Technology for course access
- Supplies for supplemental print health resources (booklets, pamphlets) and community advertising of program
Activities
What we do
- Provide access to EatFresh Mini Course through the library technology lab & troubleshoot technology issues
- Create communications brochures/ advertisements for high school and food bank to ensure students who are food-insecure know when and how to access resources available to them at the library
- Provide supplemental print health resources for students to take home and reinforce learning
- Provide transportation incentive to students to access library on a regular basis
- Train library staff on sharing health resources with the community
Outputs
What can be counted
- School-identified youth from food-insecure households visit library to participate in EatFresh Mini Course
- Youth take home supplemental health resources from the library at the completion of a session
- Youth who visit the library complete the EatFresh Mini Course
- Librarians receive NNLM Health Resources training
Short-term Outcomes
Why we do it
- Youth learn basics of good nutrition, including how to cook and store healthy foods received from the food bank
- Youth and their families access other health resources available through their local library
- Library staff improve their knowledge of health resources available through the library that benefit community members
Intermediate Outcomes
Why we do it
- Youth and their families use the EatFresh lessons to make better nutritional choices
- Library staff are seen by youth and their families as a resource for additional health information
Long-term Outcomes
Why we do it
- Youth health and nutrition improves
- Providing health assistance to youth and their families is part of at least one library staff member's official job description
Assumptions
- Local school and food bank are open to partnering with the library for the duration of the program
- Students can physically visit the library
- Students find the material interesting and complete the course
- Library staff members are dedicated to improving their practice
External Factors
- Library is only accessible via public transportation for some students (-)
- Youth may not have access/control over what meals are made in their homes (-)
- Library, school, and food bank are highly motivated to partner on this project (+)
Measurable Indicators
After developing the program logic model, Healthy Bodies = Healthy Minds staff create measurable indicators for all outcomes in the logic model. An example of a short-term, intermediate, and long-term outcome with corresponding measurable indicator is included in the chart below. The Healthy Bodies = Healthy Minds staff used the National Health Education Standards (NHES) as a guide to developing measurable indicators, and those NHES indicators are included in italics below.
| Outcome | Indicator |
|---|---|
| Short-term Outcome: Youth learn basics of good nutrition, including how to cook and store healthy foods received from the food bank | Proportion of students using the EatFresh course who score 80% or better on post-course surveys Aligns with NHE Standard 3.12.2 for Grades 9-12: Use resources from home, school, and community that provide valid health information |
| Intermediate Outcome: Youth and their families use the EatFresh lessons to make better nutritional choices | Proportion of students who report sharing lessons learned with family members about increasing healthy behaviors in the home Aligns with NHE Standard 4.12.1 for Grades 9-12: Use skills for communicating effectively with family, peers, and others to enhance health |
| Long-term Outcome: Youth health and nutrition improves | Proportion of students who report an increase in healthy behaviors after completing the Healthy Bodies = Healthy Minds program Aligns with NHE Standard 7.12.2 for Grades 9-12: Demonstrate a variety of healthy practices and behaviors that will maintain or improve the health of self and others. |
Evaluation Design & Questions
For their evaluation, Healthy Bodies = Healthy Minds staff selected a Pre and Posttest with Follow-Up design in order to address all outcomes in their logic model.
As part of their evaluation design, the Healthy Bodies = Healthy Minds staff have the option of choosing process or outcome evaluation questions. For NNLM grantees, there is NO requirement to do both. Instead, it is important to select an evaluation design and questions that will enable staff to collect the data they need to accurately report on the outcomes in their logic model. Example process and outcome evaluation questions for the Healthy Bodies = Healthy Minds program are below.
Process Questions
| Process Questions | Information to Collect | Methods |
|---|---|---|
| Were program activities accomplished? | Was the EatFresh nutrition curriculum delivered by the library as planned? | Focused staff feedback sessions Observation of activities |
| Were the program components of quality? | Did students improve their knowledge of healthy eating practices because of the delivery of the new nutrition curriculum? | Pre- and post-tests for EatFresh curriculum Feedback forms from participants |
| How well were program activities implemented? | To what extent have library staff implemented with fidelity the new nutrition curriculum? | Focused staff feedback sessions Observation of activities |
| Was the target audience reached? | What percentage of students identified as low-income by the school access the nutrition curriculum available through the library? | Attendance counts Feedback forms from participants |
| Did any external factors influence the program delivery, and if so, how? | How did the location of students’ homes impact their ability to access the library? Did the provision of bus passes mitigate this? | Feedback forms with participants |
Outcome Questions
| Outcome Questions | Information to Collect | Methods |
|---|---|---|
| Short-term outcomes | At the end of the program, did students’ awareness of good nutrition change? At the end of the program, did students and families increase their use of the library for health information? At the end of the program, did library staff members’ understanding of library health resources change? | Pre- and post-tests for EatFresh curriculum Feedback forms from participants Focused staff feedback sessions |
| Intermediate outcomes | Did the program change how many families make better nutritional choices? Did the program change student and families’ views on the library as a resource for health information? | Feedback forms from participants and parents/guardians |
| Long-term outcomes | Did the program change health and nutrition standards among students in the community? Did the program change the role of library staff in providing health information to the community? | Follow-up survey with participants and library staff |